
Hounslow's claimant count fell 435 in a year to 10,230 in July, but under-25 claims rose. Chiswick Homefields is on 3.0 per cent, Hounslow Heath on 6.0.
There were 10,230 people claiming unemployment-related benefits in the borough of Hounslow in July, 5.0 per cent of everyone aged 16 to 64. That is 435 fewer than a year earlier, a fall of 4.1 per cent, and the rate is down from 5.3 per cent in July 2025.
The fall is not spread evenly. Every year-on-year gain came from people in their late twenties, thirties and forties. Among under-25s the count went up.
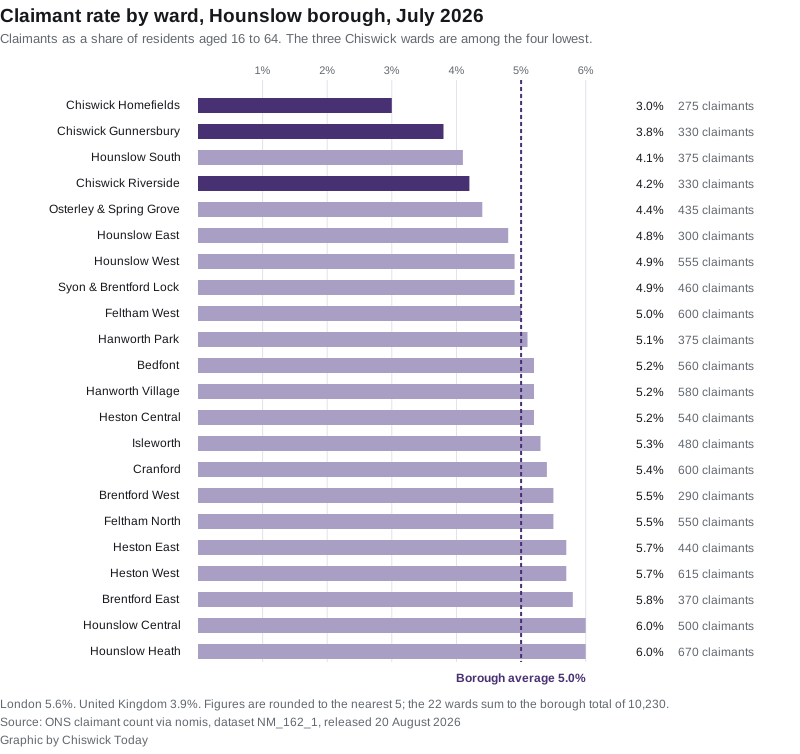
Chiswick sits at one end of the borough, Hounslow town at the other
Three of the four lowest claimant rates in the borough are Chiswick wards.
- Chiswick Homefields, 3.0 per cent, 275 claimants, the lowest of the 22 wards
- Chiswick Gunnersbury, 3.8 per cent, 330 claimants
- Hounslow South, 4.1 per cent, 375 claimants
- Chiswick Riverside, 4.2 per cent, 330 claimants
At the other end, Hounslow Central and Hounslow Heath are both on 6.0 per cent, exactly double Chiswick Homefields. Hounslow Heath has 670 claimants, more than any other ward. Brentford East is on 5.8 per cent and Heston East and Heston West are both on 5.7.
Ward figures are rounded to the nearest five. In this release the 22 wards happen to add up exactly to the borough total of 10,230, which does not always happen. The ward series only goes back a short way, so there is no year-ago ward comparison to make. The year-on-year figures below are borough-wide.
Where the year’s fall came from, and where it did not
Splitting the count by age shows the whole movement in one place.
| Age band | July 2025 | July 2026 | Change |
|---|---|---|---|
| 16 to 24 | 1,480 | 1,555 | up 75 |
| 25 to 49 | 6,410 | 5,965 | down 445 |
| 50 and over | 2,775 | 2,710 | down 65 |
The 25 to 49 band accounts for more than the entire borough fall on its own. Under-25s are the only group heading the other way, and they now make up 15.2 per cent of all claimants in the borough, against 13.9 per cent a year ago.
The monthly picture is flatter than the annual one. The count was 10,150 in June and 10,220 in May, so July is up 80 on the month. It bottomed out at 9,860 in January and has drifted up through the spring and summer.
How Hounslow compares
On the same measure and the same month:
- Hounslow, 5.0 per cent
- London, 5.6 per cent, down from 5.7 per cent a year ago
- United Kingdom, 3.9 per cent, up from 3.8 per cent a year ago
Hounslow is joint 16th lowest of the 33 London boroughs, level with Barnet, so almost exactly mid-table. Among the boroughs it borders, Richmond upon Thames is on 2.6 per cent, Hammersmith and Fulham 4.8, Hillingdon 4.9 and Ealing 6.5. The highest rates in London are in Haringey, Newham and Barking and Dagenham, all 7.5 per cent.
What the figure actually counts
This is not the unemployment rate, and it is easy to read it as though it were. The ONS definition is “the number of people claiming Jobseeker’s Allowance plus those who claim Universal Credit and are required to seek work and be available for work”. ONS labels it an experimental series.
Two consequences worth holding on to:
- Someone out of work who does not claim, or who is not required to look for work, is not in this number.
- Someone in a low-paid job can be in it, because Universal Credit claimants can be required to seek more or better-paid work.
That also means the local figures here cannot be lined up against the national headline in the ONS labour market bulletin. Those come from a different series. The comparisons in this article all use the same nomis dataset for the borough, London and the UK, which is the only way to compare them safely.
What it means for you
- If you are under 25, you are in the one group whose numbers rose this year. Hounslow Council’s Youth Skills and Employment Guarantee carries a searchable list of jobs, apprenticeships and placements. It covers people from under 14 to over 25, including care leavers and young people with Education, Health and Care Plans.
- If you are reading this as a barometer of the local economy, the ward gap is the real finding. A 3.0 per cent rate in Chiswick Homefields and 6.0 per cent in Hounslow Heath is one borough with two very different labour markets. Our Hounslow house prices page tracks the other half of that picture.
- The next national labour market release is due on 15 September 2026.
Sources
- ONS claimant count via nomis, dataset NM_162_1, “Claimant count by sex and age”, borough figures for Hounslow (E09000018), ward figures for the 22 Hounslow wards, and comparison rates for London and the United Kingdom
- ONS, claimant count source notes and definition
- ONS, Labour market overview, UK: August 2026, for the next release date
Have your say